|
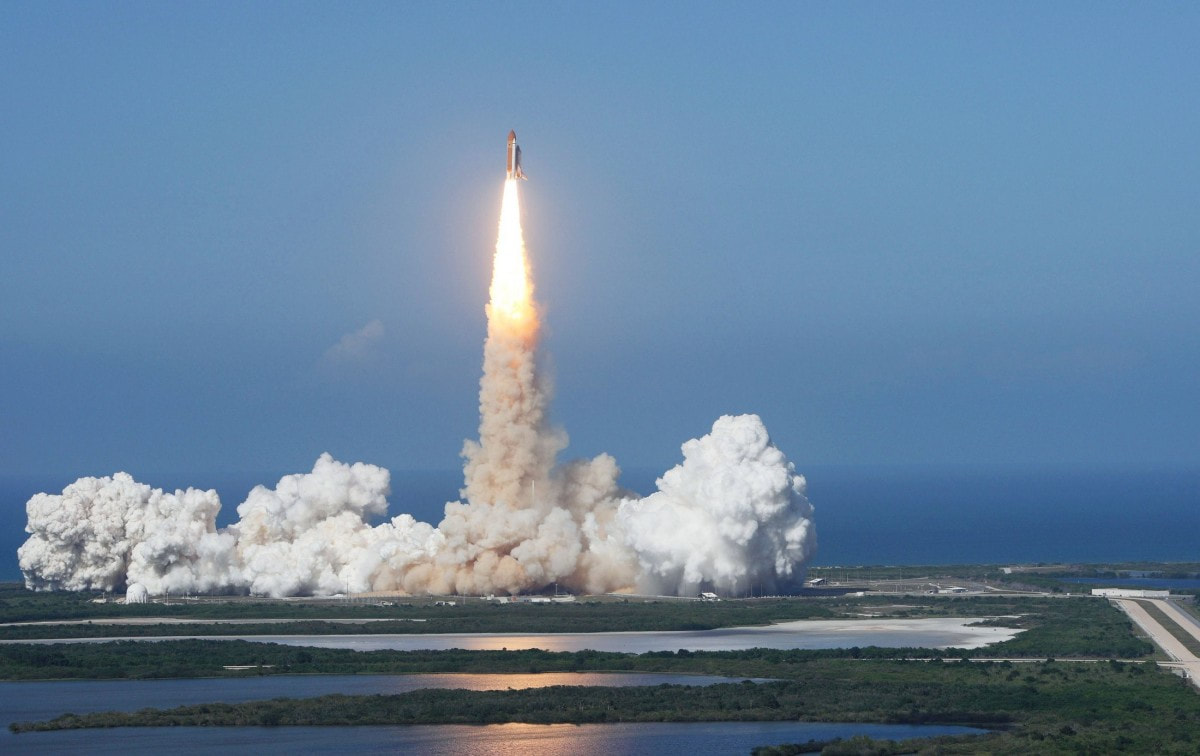
A Framework for Readiness When NASA moves to put science into practice, as in the case of the recent launch with SpaceX on May 30, 2020, the team relies on a technological readiness system to evaluate how prepared they are for the big time. This system is based on Technological Readiness Levels (TRLs). 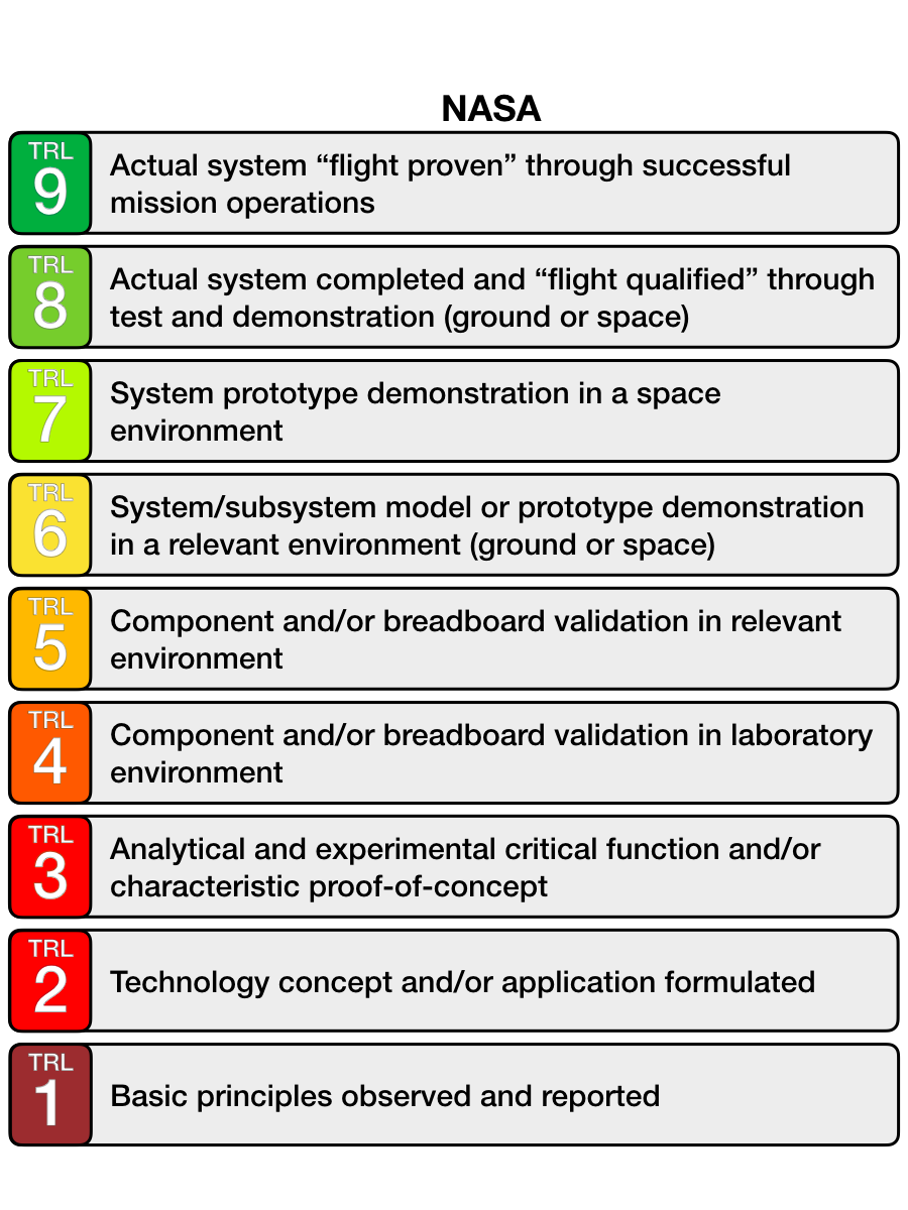 Technology Readiness Levels from NASA Directorate, Oct 28, 2012. Original figure source: https://www.nasa.gov/directorates/heo/scan/engineering/technology/txt_accordion1.html NASA’s benchmarking system consists of nine levels. It’s a way of ranking the “maturity” of any given technology, with higher levels indicating greater readiness for action. TRL4 means a system component has been validated in a laboratory environment, by TRL7 a system prototype has been demonstrated in a space environment, and to reach TRL9 the actual system must be “flight proven” through successful mission operations. (You might argue that SpaceX’s Crew Dragon has reached TRL9 with the arrival of astronauts Robert Behnken and Douglas Hurley at the International Space Station on May 31st and the successful return of the Falcon rocket booster at Florida's Port Canaveral on June 2nd). While different applied projects and different fields of study will inevitably have their own case-by-case considerations, anyone who works near the crossroads of basic and applied research should be familiar with asking this question (and its many subquestions): is our science mission-ready?
0 Comments
When police encounters turn violent, which citizens face the highest risk?Data from 2013-2018 reveal that black men face a higher risk of being killed by police than any other racial or ethnic group (and it's not even close). A black man's risk of being killed by police is approximatly 1 in 1,000 over the course of the lifetime, which is about 2.5 times higher than the risk for white men (see figure below). For every racial/ethnic group in this study, men have a much higher risk of fatal encounters compared to women, and these patterns are quite pronounced (Edwards, Lee, Esposito, 2019). 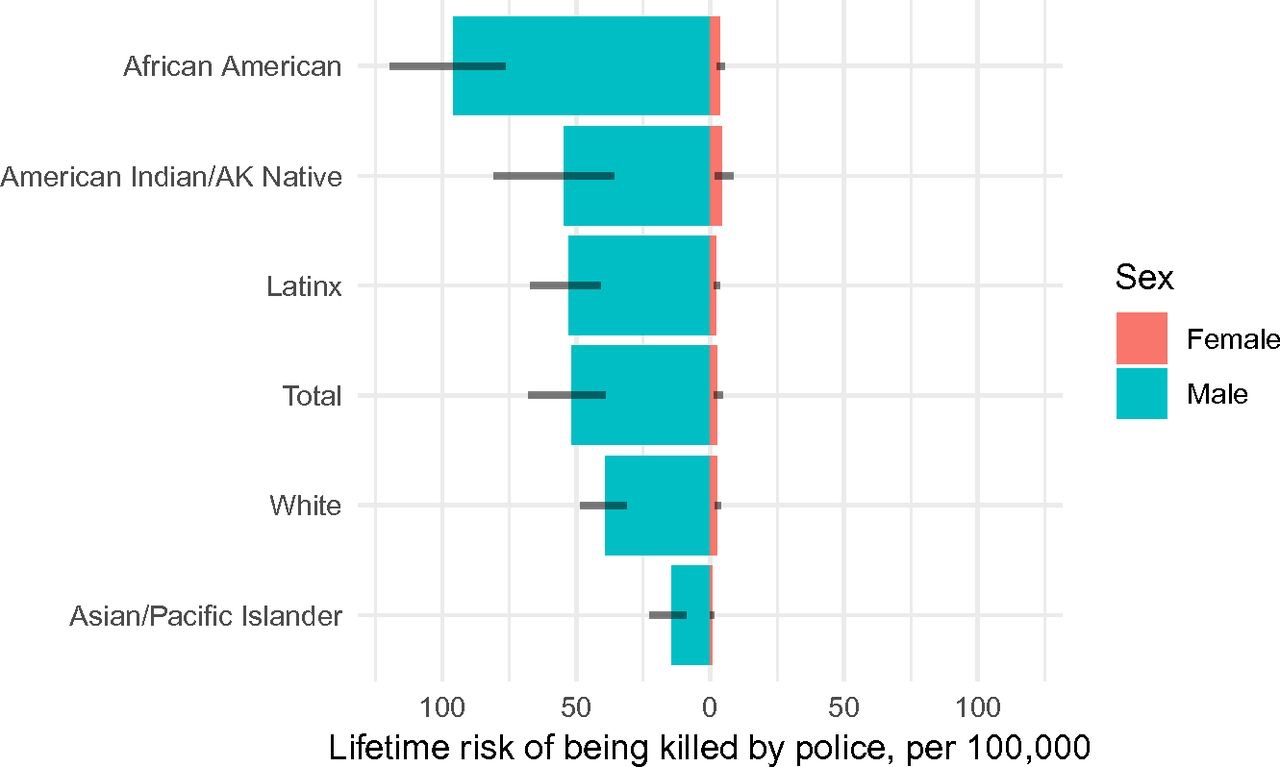 "Lifetime risk of being killed by the police in the United States by sex and race–ethnicity for a synthetic cohort of 100,000 at 2013 to 2018 risk levels. Dashes indicate 90% posterior predictive uncertainty intervals. Life tables were calculated using model-based simulations from 2013 to 2018 Fatal Encounters data and 2017 National Vital Statistics System data." Original source: Edwards, F., Lee, H., & Esposito, M. (2019). Risk of being killed by police use of force in the United States by age, race–ethnicity, and sex. Proceedings of the National Academy of Sciences, 116(34), 16793-16798. This post features research from Frank Edwards, Hedwig Lee, Michael Esposito. Their analyses draw on data from the website Fatal Encounters, a national database managed by journalists and cross-validated with multiple sources. For more detail, feel free to view the authors' full open-access article at the link below:
"Risk of being killed by police use of force in the United States by age, race–ethnicity, and sex" Proceedings of the National Academy of Sciences, Aug 2019, 116 (34) 16793-16798; DOI:10.1073/pnas.1821204116. When it comes to police use of force in the United States, this work reveals the risk of death to civilians during these interactions varies systematically. Clear disparities exist - based on sex and on race. |
Archives
September 2023
Categories
All
|

 RSS Feed